Found Local: The Real Estate SEO Playbook — Part 5 of 6
← The Boring Stuff That Makes You Rank: NAP, Citations, Local Links & a Fast Site | Real Estate in the Age of AI Answers: How to Get Cited by ChatGPT, Gemini & Google’s AI (GEO for Agents) →
In this guide
Here is the trap almost every agent falls into. You check your ranking for “realtor [your city]” on Monday, you’re #4. You check it Thursday from your phone at a listing across town, you’re #2. Friday from your home office, you’re #6. So which is it?
The honest answer is all of them, and that’s exactly why a single ranking number is the worst thing you can build your local SEO around. Rankings move with the searcher’s location, their device, their search history, and Google’s mood that afternoon. They are a symptom, not a scoreboard.
The good news: there is a small set of numbers that genuinely predict whether your phone is going to ring with buyers and sellers. They move before your traffic does, which means you can tell your strategy is working weeks before the leads show up. This article is about finding those numbers, watching the right handful, and ignoring the rest.
Stop obsessing over a single ranking
If you came out of Part 4 with a clean NAP, the right citations, and a fast site, you’ve removed the invisible penalties. Now you need to know whether all that work is paying off — and “what position am I?” won’t tell you.
Local rankings are personalized. Two buyers standing on the same corner can see different map packs. A rank-tracking tool reporting “position 3” is really reporting “position 3 from one simulated location, on one day.” Useful as a trend over months. Useless as a daily anxiety meter.
So reframe the question. Instead of “Where do I rank?” ask “Is my profile getting found, and is being found turning into contact?” Those are measurable, they’re stable, and they map directly to revenue.
The other reason to stop staring at one keyword: real estate is a long, multi-touch decision. A seller might find you in the map pack in March, read your neighborhood guide in April, search your name in May, and call in June. No single ranking captures that journey. The metrics below do.
The metrics that actually predict business
You don’t need a wall of charts. You need a short list of numbers that connect to closings. Here are the ones worth watching, grouped by where they live.
From your Google Business Profile (the closest thing to a revenue dashboard you have):
- Phone calls from your profile. Someone tapped “call” straight from the map. That is a high-intent buyer or seller, not a tire-kicker. This is the single most business-predictive number on this page.
- Direction requests. People asking their phone how to get to your office are far down the funnel. For agents this is a quieter but very real signal.
- Map and search impressions. How often you showed up when people searched. Rising impressions mean Google is surfacing you more — this climbs before calls do, which is why it’s an early-warning gauge that your work is landing.
- Website clicks from the profile. The bridge from “found you on the map” to “looking at your listings and bio.”
- New reviews and your response rate. Velocity matters more than lifetime total (more on the reviews engine in Part 2).
From the rest of your funnel:
- Branded search volume. How many people search your name, or your name plus a city. This is arguably the strongest signal of all. When buyers start searching for you by name, Google reads that as market authority — and it usually means your content, reviews, and community presence are compounding.
- Assisted conversions. The leads where local search wasn’t the last click but was an early touch. Most of your SEO value hides here. If you only credit the final form fill, you’ll badly undercount what your map presence is doing.
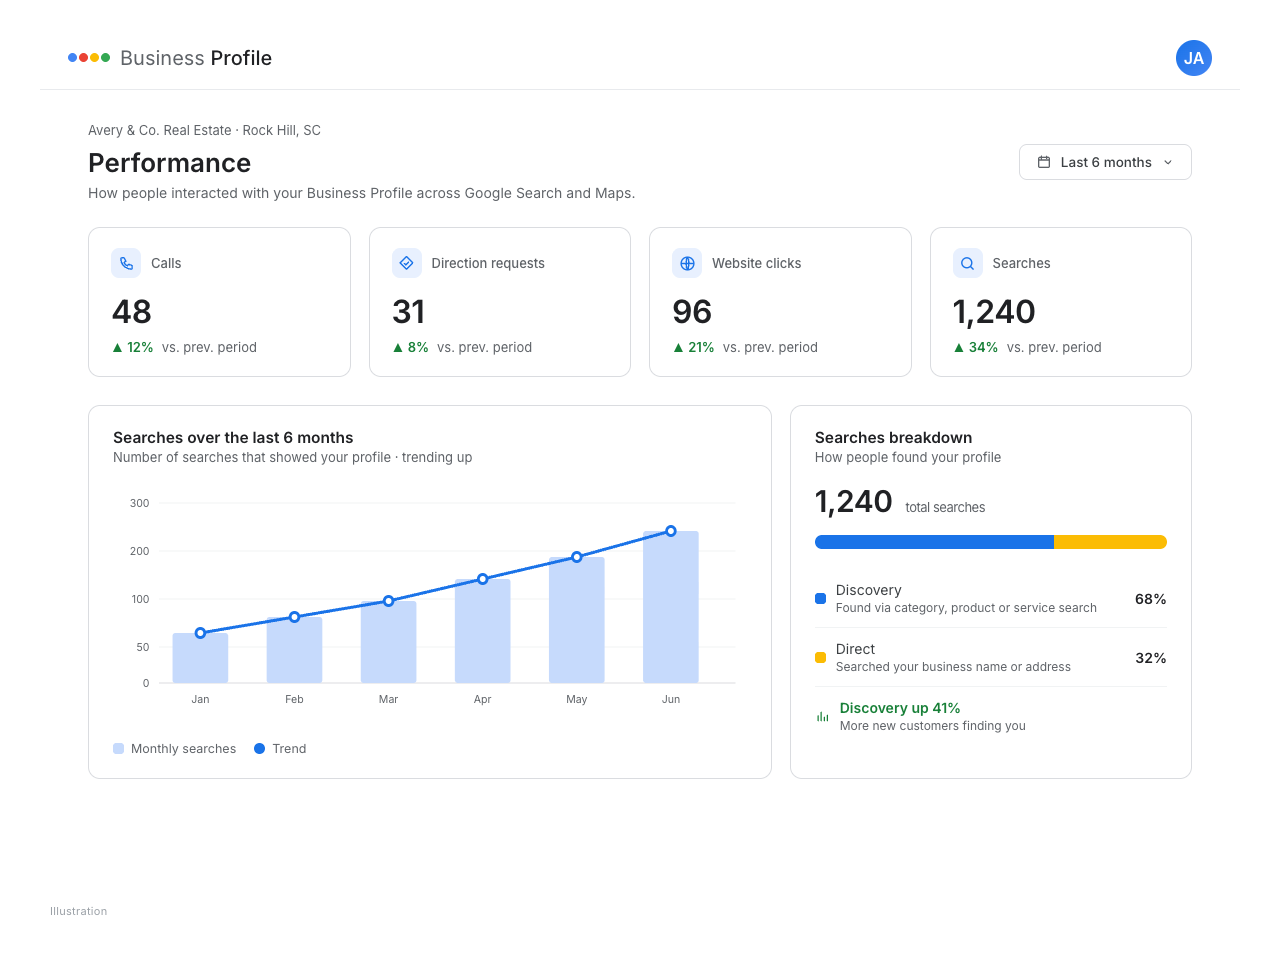
Notice what’s not on this list: bounce rate, total pageviews, “keywords ranked,” domain authority scores. None of those put a buyer in your car. Track what predicts business, and let the vanity metrics go.
One honest caveat on benchmarks. You’ll see numbers floating around the web — “an agent with 50-plus reviews gets 15 to 25 calls a month,” “leads from neighborhood content convert at 8 to 15 percent.” Treat those as illustrative, not promises. Your market, price point, and follow-up discipline swing them wildly. The number that matters is your baseline and whether it’s trending up.
The local-pack gap analysis: you vs. the top three
When you’re stuck at position 5 to 7 and can’t figure out why, stop guessing — “maybe I need more reviews?” “should I post more?” — and run a gap analysis. It’s the most useful diagnostic in this whole series, and it takes about an hour.
The idea is simple: line yourself up against the three agents who actually appear in the map pack for your target search, factor by factor, and the gaps tell you exactly where to spend your effort.
Step 1 — find your real competitors. In an incognito window, search your target terms: “realtor [your city],” “real estate agent [your city],” “[neighborhood] real estate agent.” Write down the three profiles in the map pack. Those are your benchmarks — not the agent you think is your rival, the ones Google is actually ranking.
Step 2 — compare across the factors that move local rank. Build a simple grid: you in one column, each competitor in the next, and the gap in the last. Fill in total reviews, reviews in the last 90 days, star rating, profile photo count, recent posts, and a rough read of their site and local links.
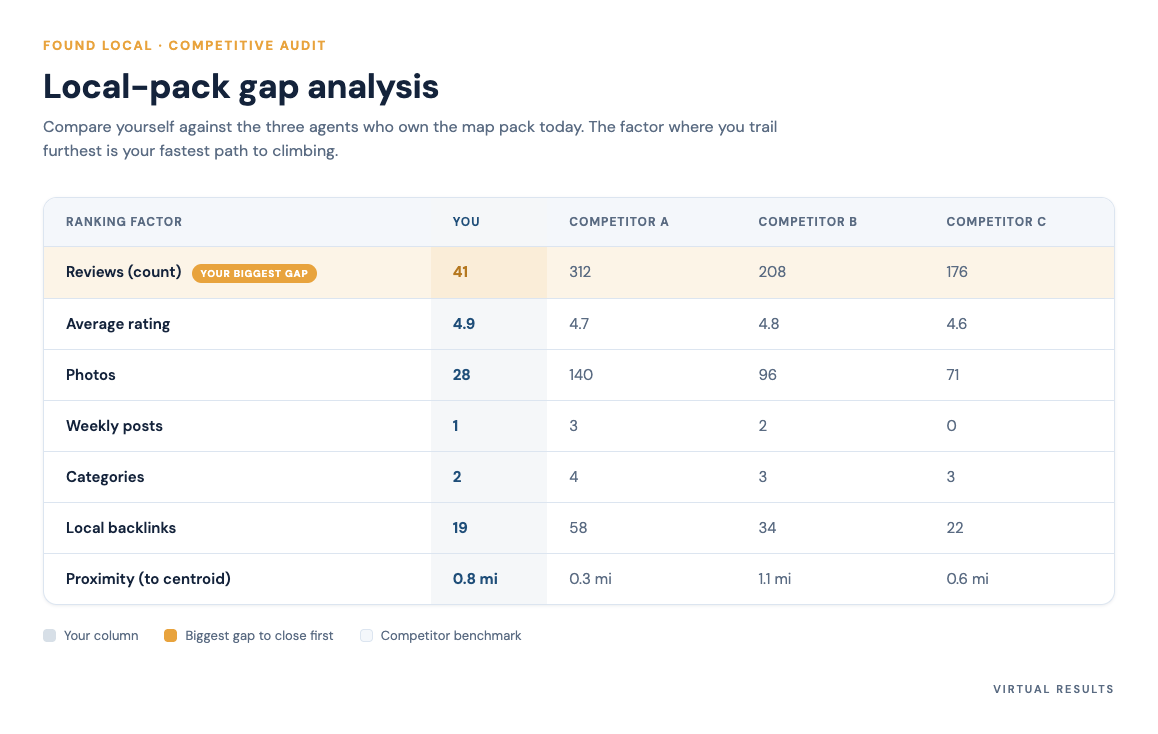
The pattern jumps out fast. Maybe your star rating is competitive but you’re 25 reviews behind, with only one review in the last quarter while they each pulled in five. Maybe you have a dozen photos and they have seventy. The biggest gap is usually your highest-leverage move, and review velocity is the most common one — it’s the fastest to fix and tends to move the needle hardest.
Step 3 — check proximity, then stop worrying about it. Rankings shift by where the searcher stands. Run “realtor near me” from a few spots around your market and note where you appear and where you vanish. If you fade in outlying areas, that’s distance, and you can’t fully control it — but a well-tuned service area and content for those outer neighborhoods help. Don’t mistake a distance problem for a quality problem.
Re-run this quarterly. The gaps you closed should shrink, and the diagnostic keeps you honest about where to point your next 90 days.
The tools worth using (and how few you need)
The local SEO tool market wants to sell you a dozen subscriptions. You need a few. Most agents are better served going deep on a small stack than juggling tools they barely open.
Here’s the short list that covers everything in this article:
- Your Google Business Profile’s own performance view. Free, built in, and it holds your most predictive numbers — calls, direction requests, impressions, website clicks. Start here. Most agents never fully look at it.
- Google Search Console. Free. This is where you see which local queries you appear for, your average position, click-through rate, and which pages are pulling impressions. It’s also your early-warning system when something slips.
- Google Analytics. Free. Connects organic and “near me” visits to what they do next — which neighborhood pages get read, which lead to a contact. This is where you start to see assisted conversions instead of just last clicks.
- One local rank tracker, optional. If you want a clean monthly trend line for your map-pack positions across set locations, a dedicated local rank tracker does that better than refreshing incognito searches. Reputable options exist; this is the one paid tool most agents can justify, and only once the free three are in place.
That’s it. Three free tools that do the heavy lifting, plus one optional paid tracker. We’re deliberately not quoting prices here — tool pricing and plan names drift constantly, so check current rates before you commit rather than trusting a figure in an article.
The thing to internalize: tools don’t create results, they reveal them. A rank tracker showing position 5 doesn’t tell you what to do; the gap analysis does. Use tools to confirm trends and catch problems, not to feel busy.
When traffic drops, don’t panic-publish
One month your numbers dip. Impressions down, a couple of keywords slipped, traffic off ten percent. The reflex is to crank out five new blog posts. That’s almost always the wrong move.
Volume isn’t the cure for a drop, and a flurry of thin posts can dilute the topical authority you built (see Part 3). Diagnose first.
- Check Search Console for the specific pages and queries that fell. A broad dip across everything points to a Google update or a technical issue. One page tanking points to that page — a competitor outdid it, or something broke. Different problems, different fixes.
- Confirm the boring foundation is still intact. A NAP change, a citation that drifted, a site speed regression, a page that got orphaned. The unglamorous stuff from Part 4 is the usual culprit behind a quiet slide.
- Strengthen what already works before making more. Identify your pages that still perform, refresh them, link to them internally, and repurpose them into video or community posts. Recovery comes from visibility and authority, not raw output.
- Keep feeding the signals that compound. Reviews, community presence, branded search. These tend to be steadier than rankings and they pull the rest back up.
And give it time. Local SEO trends move over weeks and months, not days. A single soft month inside an upward trend is noise. Reacting to noise is how agents undo good work.
A simple monthly reporting rhythm
You don’t need a reporting ritual that eats a morning. You need fifteen to thirty minutes, once a month, on the same day, looking at the same handful of numbers. Consistency beats sophistication every time.
Build a one-page scorecard — a spreadsheet is plenty — and log these each month:
- GBP calls and direction requests — your demand signals.
- Map and search impressions — your early-warning gauge.
- Branded search volume — your authority trend.
- New reviews this month and your response rate.
- Organic leads, tagged by source where you can, so you start crediting assisted touches.
- One line of notes — what you did this month and anything unusual you noticed.
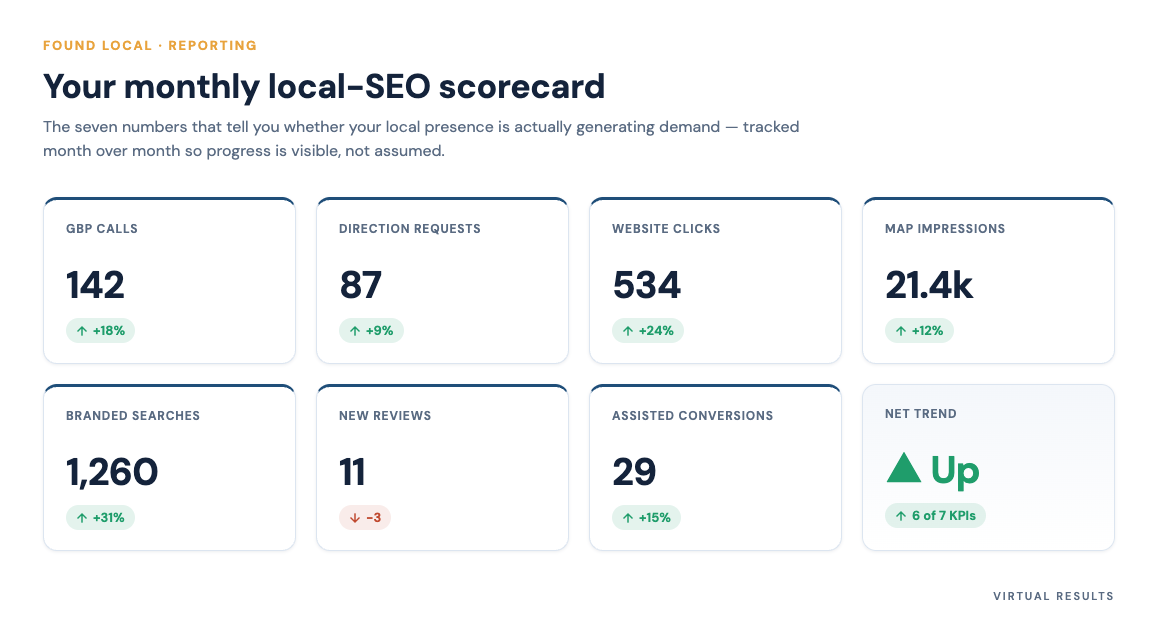
The point of writing it down is the trend line. Any single month lies; six months of the same six numbers tells the truth. You’ll see impressions climb first, then calls, then named-search and closings. That sequence is the shape of local SEO actually working — and once you’ve seen it, you stop panicking over Thursday’s ranking.
Set a recurring 30-minute calendar block. Same day each month. Update the six numbers, write your one line, decide your one priority for the next month based on the biggest gap. That’s the whole rhythm. It’s modest on purpose — modest and consistent is what survives a busy closing season.
You just finished Part 5 of 6 of Found Local: The Real Estate SEO Playbook.
Up next: Real Estate in the Age of AI Answers: How to Get Cited by ChatGPT, Gemini & Google’s AI (GEO for Agents) — buyers now ask AI “who’s the best agent in [city]?”; here’s how to be the answer it gives.
← The Boring Stuff That Makes You Rank: NAP, Citations, Local Links & a Fast Site | Real Estate in the Age of AI Answers: How to Get Cited by ChatGPT, Gemini & Google’s AI (GEO for Agents) →
Jump back into this guide
If logging six numbers a month still sounds like one more thing on a plate that’s already full, that’s exactly what we handle. At Virtual Results we build the site, wire up the tracking, and send you a plain-English monthly scorecard so you can see your local SEO working without touching a spreadsheet. Get in touch and we’ll set it up for you.