What we’re thinking about after Bright’s November 9 training.
A market chart earns its place on your website when it helps someone answer a real question: Is inventory building in my neighborhood? Are townhomes moving differently from detached homes? Is this month unusual, or does the market usually slow down now?
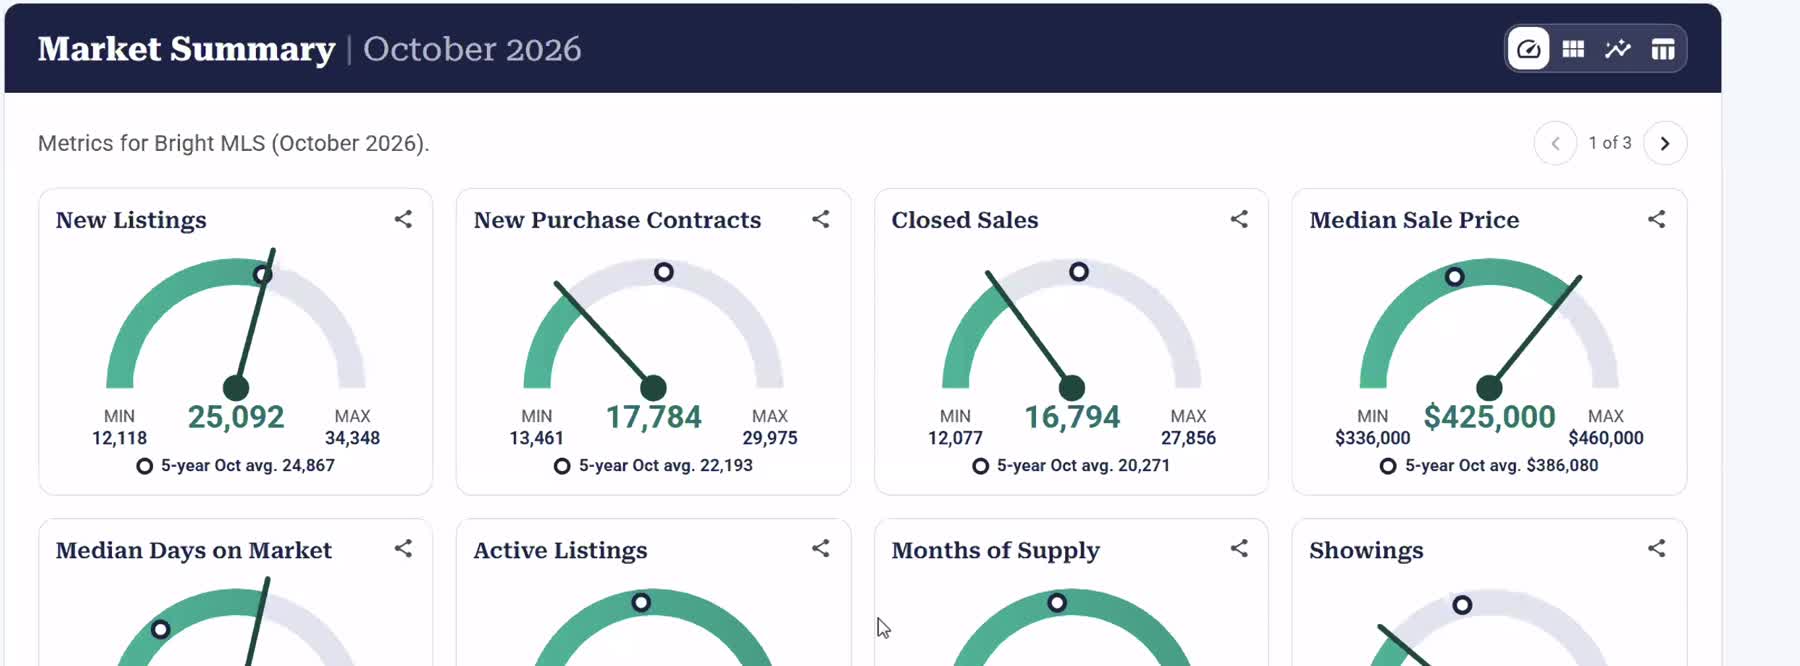
Our team attended Bright MLS’s Bright Stats training webinar on November 9. We came away with ideas for using the new tool across listing marketing, neighborhood pages, open houses and follow-up. Bright Chief Economist Dr. Lisa Sturtevant demonstrated the dashboard; the useful work for an agent is choosing a relevant slice of the market and explaining what it means.
Our first recommendation: choose one area, one property type and one client question. Build a useful page around those choices before adding a wall of charts.
What changed, and what should you check first?
Bright’s November 9 announcement says SmartCharts retired earlier than planned after a security concern identified by Zillow’s team. Bright Stats is Bright’s replacement market-reporting tool. We haven’t independently assessed the security issue; that explanation comes from Bright.
If your website used SmartCharts, check those pages now. Bright says the old auto-updating embeds no longer function and should be replaced with Bright Stats embeds. A page can still load while its chart is empty. Open the actual page, scroll to the graphic and check it on your phone, too.
Bright’s launch materials describe local filters, one- and five-year views, downloadable graphics and reports, and website embeds. Its Quick-Start Guide says monthly statistics are released on the ninth: October data becomes available November 9, for example. These are monthly market statistics, not a feed of today’s listing activity.
Ten practical ways to use Bright Stats
1. Give a listing’s blog post some local context
Alongside the photos, floor plan and property details, add a short explanation of the surrounding market. Compare a one-year view with a five-year view for the same area and property type. The shorter view shows recent movement; the longer view helps explain seasonality. Use a rolling chart if the post is intended to remain a useful resource. Keep the original listing date and sale status clear as the property’s story changes.
2. Make neighborhood pages worth revisiting
Pair local knowledge with a small set of relevant metrics: inventory, days on market and closed sales are possible starting points. Add a few sentences about what a buyer or seller should ask next. If the tool doesn’t offer the precise neighborhood geography you need, use a supported nearby geography and label it accurately. A ZIP-code chart should never be presented as a subdivision-only report.
3. Bring better context to a listing appointment
Show how the seller’s property type compares with its own recent history. Discuss supply and pace before debating a single asking price. Market statistics provide context; they don’t replace comparable-property analysis or a property-specific valuation. A smaller local sample also deserves more caution than a large county-wide sample.
4. Help buyers compare the places they’re considering
Build a short comparison around the buyer’s actual choices: perhaps townhomes in two cities, or detached homes across a few ZIP codes. Keep the time period and filters consistent. A chart comparing different property mixes can create a story the data doesn’t support. Ask which trade-offs matter to the buyer before deciding which metrics deserve attention.
5. Print one useful open-house handout
Export a relevant graphic, give it a plain-language explanation and print a clean one-page market brief. Include the area, home type, reporting month, Bright attribution and a QR code linking to the related page on your site. A visitor should be able to understand the page without hearing your entire presentation.
6. Put an explanation on an open-house tablet
Open the same neighborhood page on a tablet so visitors can explore the chart with you. Test the actual device and connection beforehand. Keep a dated PDF or printed copy available if the connection fails. The useful interaction is a conversation about the visitor’s plans, rather than a screen that rotates through unexplained numbers.
7. Offer a relevant report through a simple web form
Place a request form beside the public market summary: “Want a closer look at your property type or price range?” Ask for the area of interest and a way to reply. Explain what you’ll send. Keep the general chart accessible, and make the extra value a more useful interpretation or a more relevant selection of data.
8. Follow up with the question someone actually asked
After an open house or consultation, send a short email linking to the relevant page and answering one question from the conversation. For a buyer considering a condo, a county-wide all-home-types price graphic may be less useful than a carefully labeled condo view. Explain what you notice and invite a reply. Keep recipient consent and ordinary email preferences in place.
9. Make a monthly update you can maintain
Choose a repeatable format: one chart, one observation and one question. Put the reporting month directly in the caption. Bright’s monthly release schedule gives you a sensible time to check the page and prepare an update. A rolling chart may change automatically; your written interpretation still needs a person to review it.
10. Turn one observation into a social post and short video
Choose an approved downloadable graphic and explain one change in your own words. Identify the market, property type, date range and source. Link to your fuller article so readers can see context rather than a disconnected screenshot. For video, a clear explanation over a relevant chart is enough; dramatic claims about what the market “will” do aren’t necessary.
Want help choosing your first page? Tell us which market you serve and where you’d like to use the data. We can help you work out the page, the chart and the follow-up around it.
How do you put a Bright Stats chart on your website?
Bright’s official embedding tutorial demonstrates the workflow. Start inside your own authorized Bright account and generate the code for the chart you actually want to publish.
- Select the geography and home type. Check the reporting period and any other filters before sharing.
- Choose a metric or chart. Use the share/embed control beside it.
- Choose rolling or static. A rolling-end graphic updates as new monthly data is added. A static-date graphic preserves the selected reporting period.
- Copy the code Bright generates. Give that code and the intended page URL to your website editor. Use the provider’s generated embed, rather than a screenshot of code from a training slide.
- Publish and test the public page. Check it while logged out, on desktop and phone. Confirm that the geography, home type, period and attribution remain visible.
- Check it again after the next release. Verify the rolling graphic advances and review the explanation around it. Replace any remaining retired SmartCharts graphic on that page.

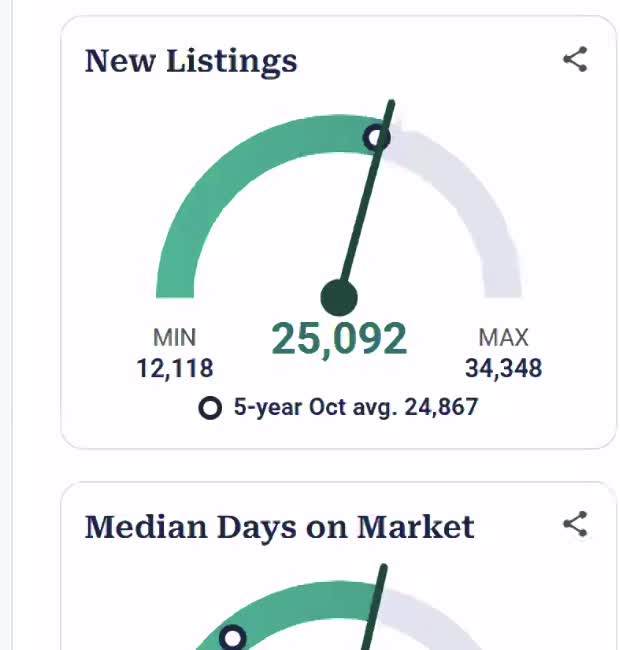
We’d use a rolling graphic on an ongoing neighborhood page and a static graphic in a dated market recap. Either choice needs a useful caption. Don’t let an automatically changing graphic make an old paragraph look like a fresh analysis.
Watch two shorter Bright walkthrough edits
These companion videos use Dr. Lisa Sturtevant’s original audio and demonstration from Bright MLS’s official November 5 walkthrough. We selected the excerpts; Bright created the underlying training. They are separate from the November 9 session our team attended. Recorded figures are examples, and the captions are automatic captions that may contain errors.
Three-minute introduction
Five-minute practical walkthrough
Start with one useful question
You don’t need ten new projects this week. Pick one existing page, remove a broken chart if there is one, and add one relevant Bright Stats view with a clear explanation. Check the experience on a phone. Then use the page in a real client conversation and see which questions come back.
For product access and training, contact Bright MLS support at 1-844-552-7444 or [email protected]. Bright’s coaching resources are another place to start.
For help putting this to work on your website, schedule a conversation with Virtual Results. Bring the page you want to improve and the client question you want it to answer.
Sources: Bright Stats launch announcement; Quick-Start Guide; embedding tutorial; and official walkthrough. Product screens and original training audio © Bright MLS. Screenshots are from the November 9 session; companion video excerpts are from November 5. The ten marketing applications are Virtual Results’ suggestions, not claims that these projects have already been installed on client sites.