How to Add Bright Stats to Your WordPress Website
Choose the right chart, replace a retired SmartCharts embed, and publish a readable market page with a reporting date and source.
Ryan Rockwood · 4 min read
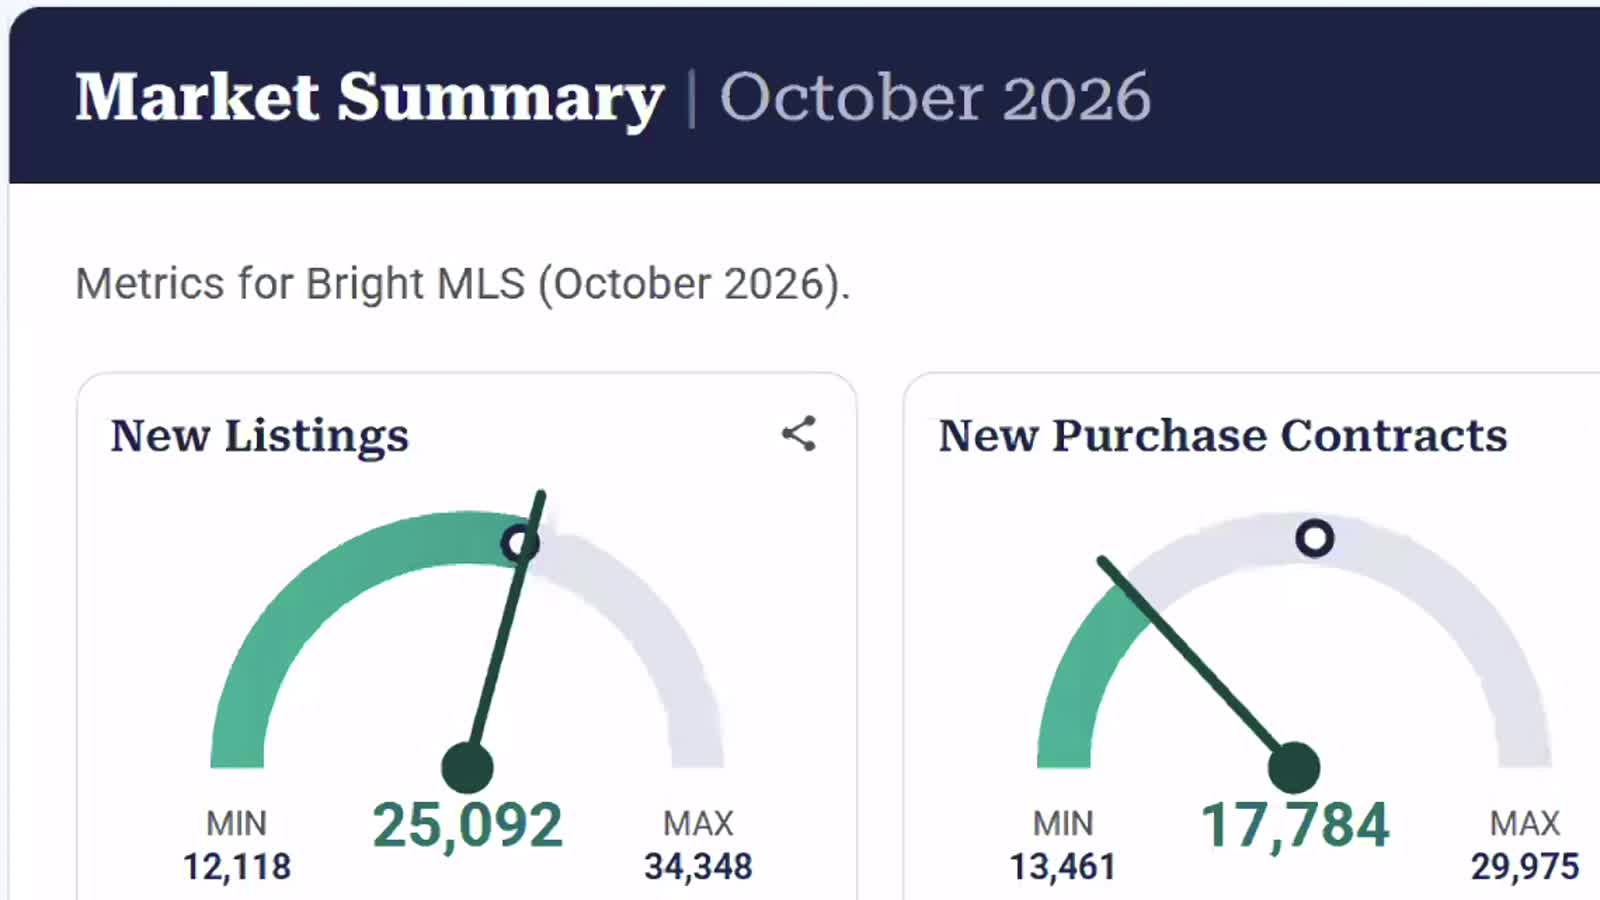
On this page
Back to the Bright Stats guide
This is the practical path for getting a Bright Stats chart onto an existing WordPress website. You need authorized access to Bright Stats and permission to edit the destination post or page. Our automatic enrichment installer is coming soon; the manual workflow below is available now.
Choose the question and the destination
Start with the page you want a client to visit. A maintained local market page works well for a rolling chart. A dated article works well for a fixed-period recap. WordPress posts and pages can both contain a report; use the content type that fits your site’s organization, and keep its URL stable.
Write down the area, property types, and question. For example: “Woodbridge, all home types, how have supply and selling time changed since last October?” Keep the distinction between average and median prices. If Bright does not support your exact neighborhood boundary, choose a supported geography and label it accurately.
Generate the embed inside Bright
- Sign in to your own Bright account and open Bright Stats.
- Select the geography, home types, and other filters relevant to your question.
- Select the metric and chart presentation you want.
- Open its share/embed control. Use Bright’s current tutorial for the exact controls.
- Choose the intended date behavior: a rolling report for a maintained page, or a fixed date range for a historical recap.
- Copy the complete provider-generated iframe code. Keep it paired with the metric and filters so a later editor knows what it represents.

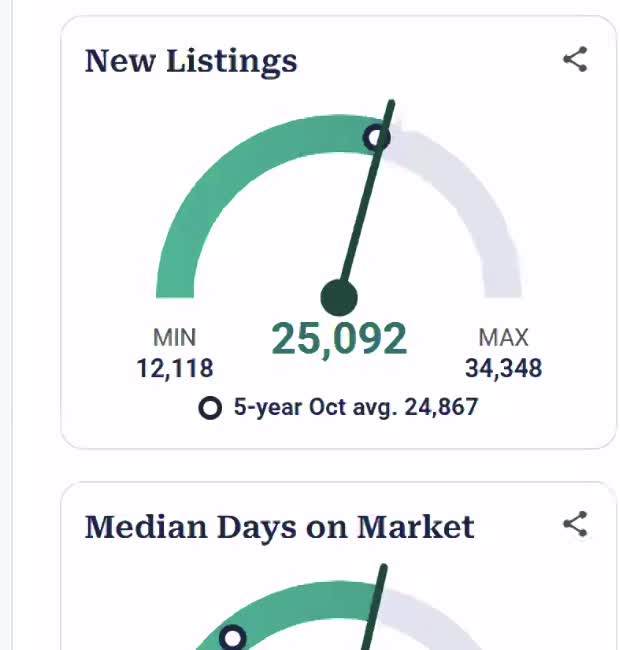
Watch Bright’s official embedding tutorial.
Place it in WordPress
Open the existing destination in the WordPress editor. Save its current content or use a revision before replacing an old embed. In the block editor, add a Custom HTML block and paste the full iframe code. In the Classic Editor, use the Text/HTML view. A site builder may provide its own HTML or embed element.
Place the chart after a useful heading. Add the market name, reporting period, home types, and a short explanation nearby. Leave Bright’s attribution visible. A restricted editor may remove iframe code when you save; ask your website administrator to use the site’s supported embed method rather than weakening permissions.
Preview the actual post. The editor canvas is not always a reliable picture of an embedded chart. Confirm that the public-facing preview loads the right data and that the frame does not cut off its labels.
Add context without burying the chart
A caption can answer one question: “Homes that sold in October spent an average of 31 days on market, compared with 27 a year earlier.” A longer report can sit underneath in a clearly labeled expandable section. An HTML details/summary element is one way to make the explanation available without displaying every paragraph at once.
Keep the written report in the page content. Do not make someone press a button merely to fetch the only readable version of the figures. Include a compact table when people may want to compare values precisely.
Try the visual-first report example. The figures there are a dated demonstration, not a forecast or a live text refresh.
Check the page before you publish
- Correct selection: area, geography level, property types, metric and dates all match the intended report.
- Readable layout: inspect desktop and a phone; scroll through the full report and open its expanded sections.
- Working embed: verify the actual graphic, not just an empty frame or an editor placeholder.
- Honest dates: a downloaded graphic and a written paragraph are snapshots unless a real refresh process updates them.
- Source: preserve Bright attribution and link to the relevant source chart or report.
After publication, open the ordinary page while logged out. Check its article link and thumbnail in the blog archive if it is a post. Revisit a rolling report after Bright’s next monthly release and confirm the chart and explanation still agree.
Have an assistant prepare the draft
Supply the actual embed, your reporting facts, and the destination URL. An assistant can help organize the report even without a website connection. If you have a working website connection, ask it to identify the site and its permissions before editing, then save a draft and return the preview.
Copy the website-draft prompt
Help me create a WordPress market-report draft for [AREA] using the Bright Stats embeds and source figures I provide. Preserve the original embed codes and Bright attribution. Keep the charts prominent. Add useful captions, an expandable written report and an accessible comparison table. Label the actual reporting month and property types. Match my existing website design. If connected to my website, first identify the site and available permissions, then save a draft and return its preview. Otherwise give me semantic WordPress-ready HTML and a local preview. Do not publish or claim it will update automatically.
A local HTML preview is useful for exploring a layout; WordPress still needs the article content and supported components. Do not paste a whole standalone document, its navigation, or an unrelated site theme into a post body.
If it does not work
If WordPress removes the code, check editor permissions and the supported HTML element. If the frame is empty, reopen the original Bright share link and confirm it still works. If the labels are clipped, check the frame’s supported dimensions. If an explanation is out of date, update it or identify it as a dated recap.
Send us the destination URL and the chart you want to show. For Bright account access, use Bright support.