Bright Stats Report Companion: Keep the Charts, Add the Context
Explore the before-and-after design for readable Bright market reports, source links, useful schema, and exportable website content. Generator coming soon.
Ryan Rockwood · 3 min read
On this page
Back to the Bright Stats guide
Coming soon: the enrichment generator. You can explore the report design and download its example figures today. Importing your embeds, creating an account, and installing an automatically refreshed report are not integrated yet.
People like market charts because a picture is often easier to understand than a spreadsheet. Our report companion is designed to preserve that experience while giving readers a fuller explanation and giving crawlers ordinary page content to process.
Try the before-and-after example
Open the full interactive example · Download the example data
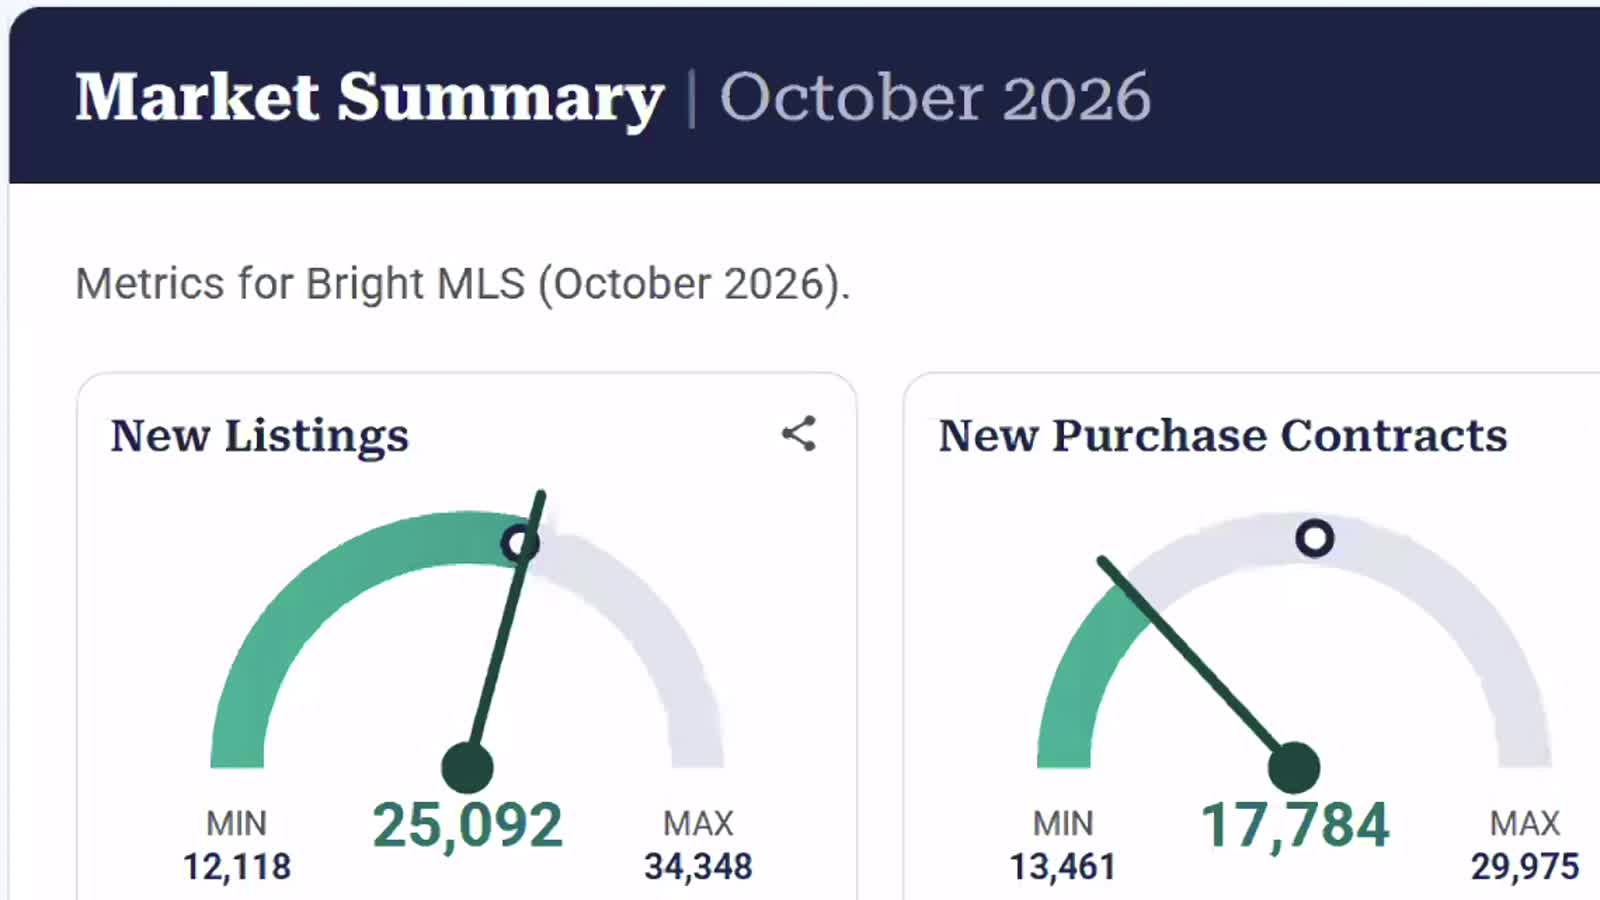
The demonstration uses October 2026 Woodbridge figures from the public charts on Pierson Real Estate’s website. It is a proposed presentation, not an installation on Pierson’s site. The report is a dated example and is not automatically refreshed.
How the tool is intended to work
- Bring the source. Paste a market-page URL or one or more Bright-generated embed codes. A page importer should collect the codes it can actually find and ask you to confirm them.
- Check the selection. Review each area, property type, metric, reporting period, and comparison. Two charts with different filters should not quietly become one report.
- Add your identity. Supply your business name and website, plus any verified agent profile, contact information, service area, and source references you want included.
- Choose the presentation. Keep charts prominent; add captions, an expandable report, and a table. Preview both desktop and mobile.
- Choose delivery. Export a dated report or use a supported installation for a maintained companion. These are different products with different refresh behavior.
- Review and publish. Check the figures, sources, visible layout, and structured data on the actual destination.
What a useful package contains
The intended website package includes semantic article content, the original embeds, a dated market explanation, comparison tables, source links, and compatible JSON-LD. A data export would include exact units, filters, reporting dates, and provenance. We will only offer data download and redistribution features supported by the applicable provider permissions.
The text should say something useful: what moved, by how much, against which period, and what the reader might investigate next. It should not turn an increase in average price into a claim about every home’s value or invent a market forecast.
Which schema belongs in the report?
Schema is machine-readable description. It works best as a connected account of the same people, places, dates, and evidence visitors can find in the report.
| Entity | What it describes | What must be true |
|---|---|---|
| WebPage / Article | The page and its written analysis | Correct publisher, dates and page identity |
| Dataset | The market data’s coverage, variables and provenance | Actual geography, periods, source and measured variables |
| Place | The market or neighborhood being discussed | Verified place identity; no invented boundary or coordinates |
| RealEstateAgent | The applicable real-estate business | Verified business identity and any published contact details |
| Person | An individual agent or author | Verified professional identity and relationship to the business |
| DataDownload | A real downloadable data file | The file exists and distribution is authorized |
A neighborhood can be described as a Place. A chart labeled by Bright as a city, ZIP code or county must retain its actual coverage; the page’s neighborhood heading cannot change that coverage. Business service area and dataset geography are also different facts.
Bright remains the source of its figures. The agent may publish the explanation without becoming the creator of Bright’s underlying data. We should reuse a site’s existing business entity rather than generate conflicting identities on every market page.
Google’s dataset documentation explains dataset descriptions; its structured-data guidelines require accurate, representative content. Markup does not guarantee indexing, rich results, rankings, or AI recommendations.
Copy the schema-review prompt
Review the visible market report and the verified business information I supply. Propose a connected JSON-LD graph for its WebPage or Article, Dataset, Place, and real-estate business. Use Person for an individual professional and RealEstateAgent for the applicable business. Reuse existing entity IDs where possible. Keep Bright MLS identified as the data source, distinct from the report publisher. Only include verified addresses, coordinates, service areas, profiles and dates. Do not assert a data license, downloadable distribution or neighborhood boundary without evidence. Return a field-by-field explanation and a list of missing facts. Do not promise rankings.
Make the refresh promise explicit
A rolling Bright chart can receive a newer reporting month while a pasted paragraph remains unchanged. A maintained companion needs a real retrieval and validation process that updates the chart’s supporting text, table, and schema together. If retrieval fails, retain a clearly dated last-good report and show its status. Do not replace missing data with zero.
Until that integration is available, use a dated snapshot and review it when preparing your next report. The manual WordPress tutorial shows the current path.