Use an AI Browser Assistant to Prepare Your Bright Stats Market Page
A guided workflow for selecting charts, collecting provider-generated embed codes, preparing a report, and reviewing a WordPress draft.
Ryan Rockwood · 4 min read
On this page
Back to the Bright Stats guide
An AI browser assistant can help with the visible steps of preparing a market page when your assistant supports browser control and can work in your authorized session. This is a guided workflow, not a claim that Bright has released a dedicated ChatGPT or Claude browser plugin.
Virtual Results’ automatic browser-to-enrichment workflow is coming soon. You can use the prompts and review steps below with a browser assistant you already have. Its supported websites, actions, account requirements and sign-in behavior will determine which steps it can complete.
Prepare the task before giving the assistant control
Open your own Bright account through its normal sign-in flow. Choose the destination website and make sure you have the right editing permission. Have a specific market question ready, with its geography and property types.
For example: “Prepare a Woodbridge market-page draft for all home types, comparing the latest available October figures with the previous October.” If the assistant cannot use that exact geography, it should ask you to choose a supported one rather than silently changing the market.
Ask it to collect the actual embed codes
Copy the browser-assistant prompt
Use my current authorized browser session to help prepare Bright Stats charts for [AREA] and [HOME TYPE]. Confirm those filters and the reporting period before acting. Find the share/embed control and collect the exact provider-generated codes. Keep each code paired with its metric and filters. Do not change my account settings, create accounts, bypass sign-in, or publish. If downloading a report is available, ask me which offered format I want. Stop and explain any missing access or unsupported action.
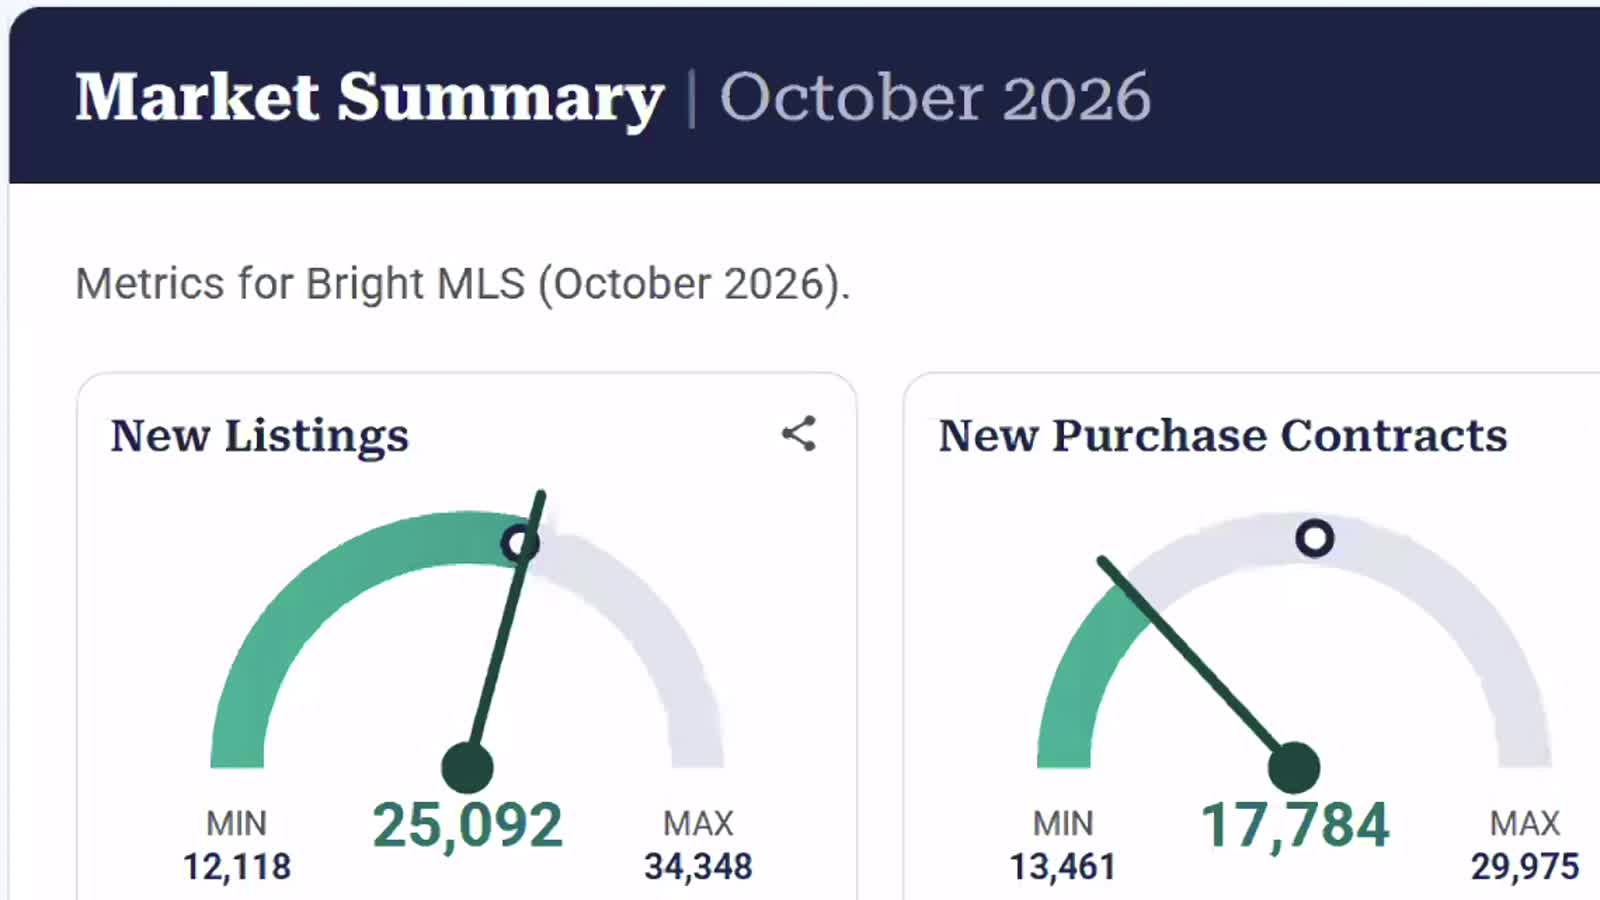
The assistant should verify the selected filters, find the share control, and copy the complete code Bright generates. Have it create a small inventory: chart name, area, home types, date behavior, and the matching embed. That inventory prevents a detached-home chart from being mislabeled as an all-home-types report.
If a login, account check, or browser permission requires you, complete that step through the normal interface. If the assistant cannot operate the share control, copy the code yourself and continue with the drafting step. You do not need to turn a routine copy operation into a new account integration.
Decide what to download
A chart image is useful in a handout or presentation. A provider report is useful for reading and review. An available data export is useful when the assistant needs exact numbers. The embed is useful for an interactive website chart. Choose among the formats Bright actually offers in your session; do not assume every chart supports every export.
Keep the original source file and its period. A screenshot is not a data export, and a downloaded image will not update when the underlying market changes.
Turn the source into a website draft
Copy the WordPress-draft prompt
Help me create a WordPress market-report draft for [AREA] using the Bright Stats embeds and source figures I provide. Preserve the original embed codes and Bright attribution. Keep the charts prominent. Add useful captions, an expandable written report and an accessible comparison table. Label the actual reporting month and property types. Match my existing website design. If connected to my website, first identify the site and available permissions, then save a draft and return its preview. Otherwise give me semantic WordPress-ready HTML and a local preview. Do not publish or claim it will update automatically.
Without website access, ask for semantic article HTML and a local preview. With a working website connection, first ask the assistant to identify the correct site, then have it save a draft through the supported editor. Keep the original embeds intact and check that the written report matches their actual filters.
The report can have charts first, short explanatory captions, and an expandable section for readers who want the full comparisons. Explore that layout in our before-and-after example.
Review the result as a visitor
- Open the actual draft preview on desktop and phone.
- Scroll to every chart and confirm it paints the expected market data.
- Open the report section and compare the numbers with the source.
- Check the reporting month, home types and attribution.
- Test source links and any downloads.
- Publish only after reviewing the actual destination, then check the public page while logged out.
Ask the assistant to report what it completed, what it could not access, and the exact draft URL. “Done” without the saved destination is not a useful handoff.
Browser assistance, MCP, and enrichment do different jobs
A browser assistant works through a visible interface. An MCP connection exposes defined information and actions to a compatible assistant. The enrichment tool turns source evidence into a useful report package. They can cooperate, but one is not proof that the others are installed.
Read about the planned MCP connection or follow the manual WordPress tutorial if you prefer to complete the steps yourself.