Bright MLS Stats: Your Guide to Charts, Website Reports, and AI
Replace SmartCharts, build a useful market page, and explore our next step: visual Bright reports with readable explanations and an AI connection.
Ryan Rockwood · 7 min read
On this page
- What would you like to do?
- SmartCharts was replaced. Check your old pages.
- Watch the short walkthroughs
- Start with the three-minute introduction
- Then watch the five-minute practical walkthrough
- Build around a question, then choose the charts
- Keep the visuals. Add the explanation.
- What can a search engine actually read?
- The enrichment tool we are building
- The same evidence, available to your AI assistant
- A useful thing you can do today
- Sources and help
A good market chart helps someone understand what is happening where they live. Put it on a useful page, explain the change, and you have something worth sharing with a seller, a buyer, or the people who keep asking whether the market has slowed down.
Bright Stats gives Bright MLS subscribers a new way to do that. This guide brings together the replacement for SmartCharts, the website tutorial, practical examples, and the next tools we are building at Virtual Results.
You can use Bright’s charts and the manual website workflow today. Our enrichment generator and Bright Stats MCP connection are coming soon. Their sections below show the intended result and give you prompts you can already use with data you supply.
What would you like to do?
| Your task | Start here | Availability |
|---|---|---|
| Replace an old chart or add a new one | Bright Stats on WordPress | Manual tutorial |
| Give charts useful written context | The report companion | Interactive example; generator coming soon |
| Ask an assistant about my market | Bright Stats and MCP | Planned connection; prompts available |
| Have an AI browser help with the setup | The browser-assistant tutorial | Guided workflow; depends on your assistant |
SmartCharts was replaced. Check your old pages.
Bright Stats is Bright MLS’s replacement market-reporting tool. In its November 9 launch announcement, Bright said SmartCharts retired earlier than planned following a security concern identified by Zillow’s team. That is Bright’s explanation of the retirement; this guide does not independently characterize the security issue.
The practical consequence is straightforward: an old website page can still open while its SmartCharts graphic is empty. Visit your market pages, scroll to each chart, and check the phone version. Replace retired embeds with codes generated inside your own authorized Bright account.
Start with Bright’s announcement and its Quick-Start Guide. Bright’s launch guide describes monthly reporting, with new monthly statistics released on the ninth. A chart about October is an October report, even when someone opens it in November. It is not a stream of today’s listing activity.
Watch the short walkthroughs
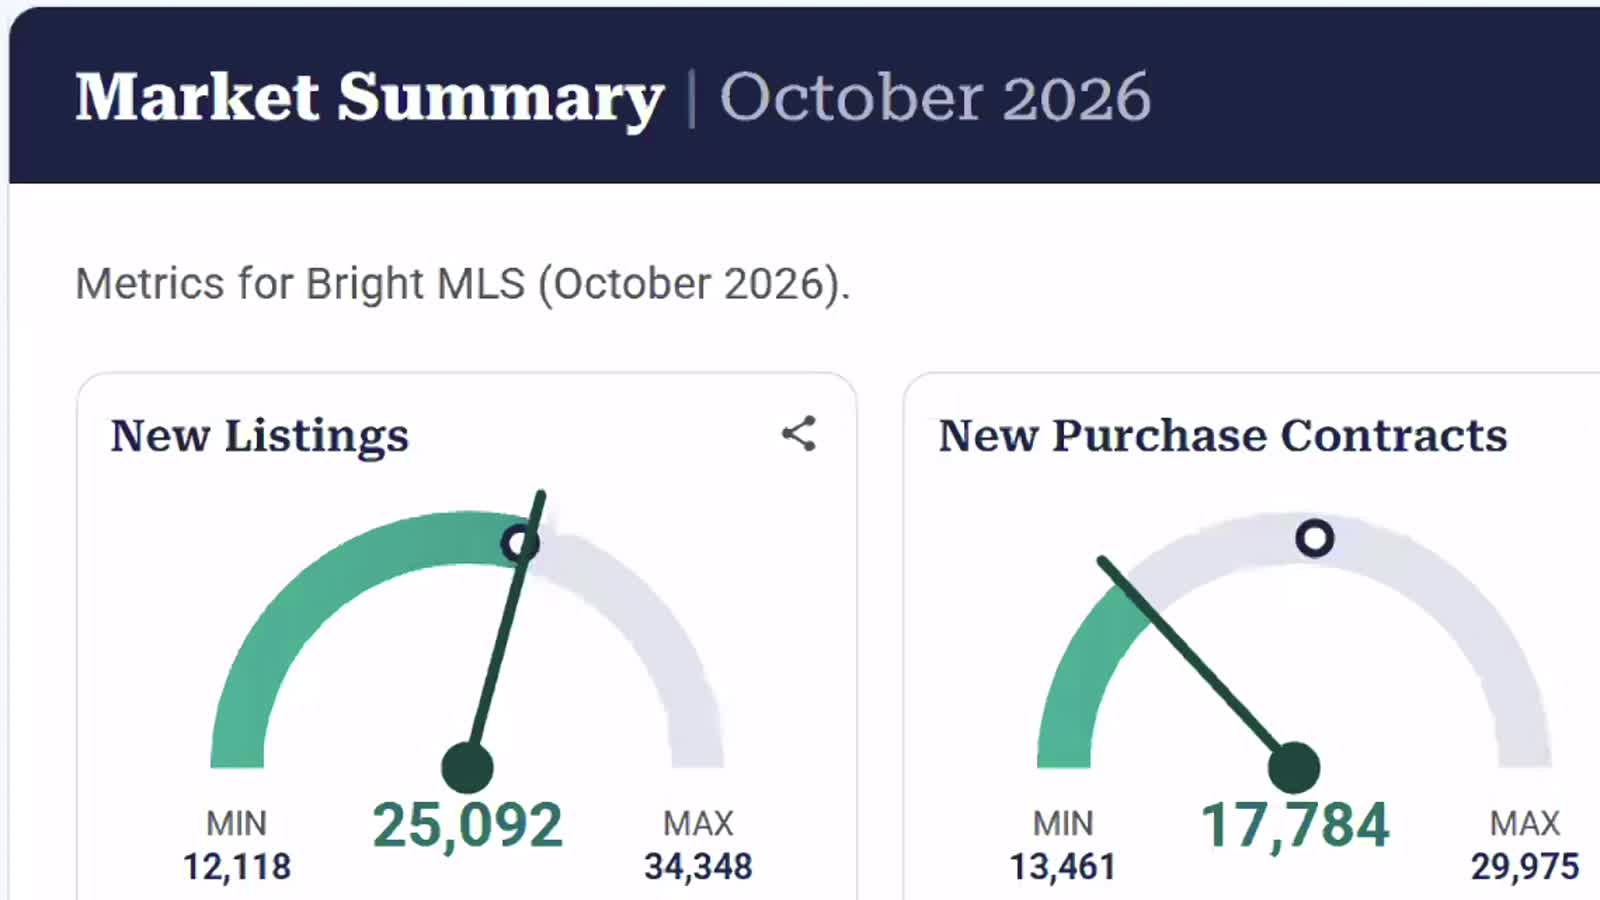
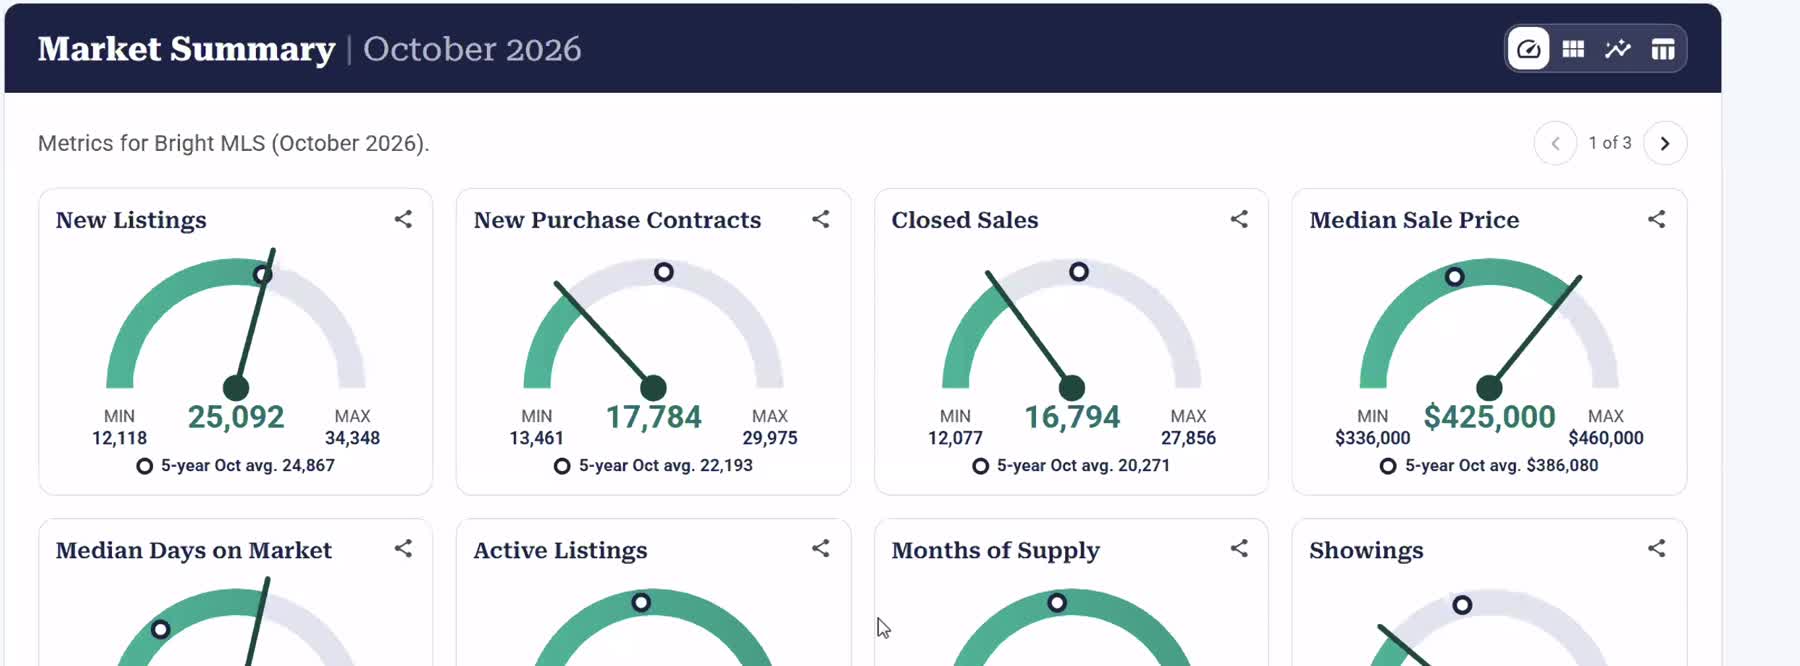
These two edits use Dr. Lisa Sturtevant’s original demonstration and audio from Bright MLS’s official November 5 walkthrough. Bright created the underlying training; Virtual Results selected the excerpts. The screenshots elsewhere in this guide come from the separate November 9 training. Recorded figures are examples, and automatic captions can contain errors.
Start with the three-minute introduction
Open the video in its own player
Then watch the five-minute practical walkthrough
Open the video in its own player
For the provider’s current controls and options, use Bright’s embedding tutorial and full official walkthrough.
Build around a question, then choose the charts
“What is happening in Woodbridge?” is a starting point. “Are detached homes taking longer to sell than they did last October?” gives you something specific to explain. Select the supported area, the relevant property type, and a consistent comparison period before choosing your visuals.
A useful first page might show prices, supply, and selling time, with the reporting month in plain view. The right number of charts is the number needed to answer the reader’s question. Keep a ZIP-code report labeled as a ZIP-code report; it does not become subdivision data because you put it on a neighborhood page.
- A seller conversation: compare available supply and selling time, then explain what further property-specific research is needed.
- A buyer comparison: show the same home type and period in the places the buyer is actually considering.
- An open-house handout: use a dated graphic, one useful observation, the source, and a link back to the fuller report.
- A monthly email: answer one question and link to a maintained market page.
Our original ten Bright Stats marketing ideas develops these applications. They are suggestions, rather than claims that every example has been installed on a customer’s website.
Keep the visuals. Add the explanation.
The charts are the attraction. We want to keep them prominent and give people a helpful second layer: what changed, which period the figures describe, and where the numbers came from.
Try the example below. Switch between the chart-only view and the proposed report companion. Open the written report, compare the figures, and inspect the source context. This is a working design demonstration using a dated October 2026 Woodbridge example. It does not connect your account or automatically refresh the written report.
Open the full before-and-after example · Download the example figures
On Pierson Real Estate’s Woodbridge page, Bright charts already supply the visual experience. Our companion is a proposed addition, not an upgrade we have already installed there.
What can a search engine actually read?
An iframe places another document inside your page. The Bright chart and its data are delivered from Bright’s service; the surrounding page belongs to the agent. In the chart we inspected, the initial embedded HTML was an application shell, and the application requested the numerical data separately.
That does not mean Google is blind to iframes. Google says it tries to associate embedded content with the containing page, but the association is not guaranteed. Other crawlers and assistants can have different rendering capabilities.
Compare the page content with and without a companion
Chart only: the surrounding page can contain a title and an iframe address, while the chart’s figures arrive inside a separate document. A crawler must successfully process that embedded document to obtain its contents.
With the companion: the agent’s page also contains an ordinary heading, a dated explanation, the actual figures in a table, and source links. Those words and numbers remain part of the page even when the interactive chart fails to load.
This is a comparison of delivery methods, not a screenshot of Google’s index. Search Console’s URL Inspection is the appropriate next check for an actual published page.
The enrichment tool we are building
Coming soon. The proposed workflow is to import an existing market-page URL or paste one or more Bright embed codes, confirm their filters, add your verified business details, and preview the result. You would then export the report or install it through a supported website connection.
The output is intended to keep the original charts and add a readable report, accessible tables, source references, and appropriate structured data. A dated download and a maintained live companion will be clearly different choices.
See the enrichment workflow, the schema model, and what the download would contain. No account registration is needed to explore the example. Account creation and automatic embed import are not available here yet.
The same evidence, available to your AI assistant
The Bright Stats MCP is coming soon. MCP is a way to give a compatible assistant access to defined tools and information. The intended connection would let you ask for a market’s figures, retrieve a historical comparison, and prepare a briefing without interpreting a chart by eye.
It would return reporting dates, filters, units, and sources along with the numbers. Permission to read market data and permission to edit a website are separate. A website connection should not silently become permission to publish.
Read the MCP overview and try the preparation prompts. You can already work with an export or source material you supply; our live Bright Stats connection, login flow, and assistant-specific setup are still being built.
A useful thing you can do today
Choose one existing market page. Replace its retired chart, if necessary. Add a short, accurate explanation with a visible reporting month. Test the public page on your phone. Then use that page to answer a real client question.
Copy a prompt to understand the source figures
Read the Bright Stats data or export I provide. Identify the geography, geography level, property types, metric definitions and latest reporting period first. Summarize the main changes against the same period last year. Show the underlying figures and calculations. Separate observations from interpretations. Cite the supplied source. Do not invent missing figures, neighborhood boundaries or a forecast. Ask for a source export if the chart is not readable.
Copy a prompt to prepare a website draft
Help me create a WordPress market-report draft for [AREA] using the Bright Stats embeds and source figures I provide. Preserve the original embed codes and Bright attribution. Keep the charts prominent. Add useful captions, an expandable written report and an accessible comparison table. Label the actual reporting month and property types. Match my existing website design. If connected to my website, first identify the site and available permissions, then save a draft and return its preview. Otherwise give me semantic WordPress-ready HTML and a local preview. Do not publish or claim it will update automatically.
Follow the WordPress tutorial, or ask us to help with your market page. Bring the page URL and the client question you want it to answer.
Sources and help
Bright MLS is the source of Bright Stats product training and underlying market figures. Virtual Results supplies this guide and the proposed companion design. We are not describing a Bright-endorsed integration.