The quietest part of running a real estate website is the part doing the most work: the monitoring that watches your site breathe, so a small problem at 3 a.m. never becomes a dark homepage at 9 a.m.
Here is a small confession from the Virtual Results Platform Team: the work we are proudest of is the work you will never notice. When everything goes right, nothing happens. Your listings load, your contact forms send, your map pans smoothly, and you never once think about the machinery underneath. That invisibility is the product. This post pulls the curtain back on it.
TL;DR
- A simple uptime check that returns “200 OK” can be completely true and completely useless at the same time. It sees a pulse, not the patient.
- Real monitoring watches metrics (query times, memory pressure, worker counts), not just whether the front door opens.
- Good alerts fire on trends (a cluster of warnings in a short window), not single hiccups. That is the difference between useful and exhausting.
- A site like yours runs on several independent services. Layered, per-service health means a problem gets located, not just noticed.
- The goal is predictive, not reactive: catch the trouble while there is still time to fix it quietly.
On this page
The pulse-check problem
The simplest way to “monitor” a website is to poke it every minute and see if it answers. The poke is called a ping; a healthy answer is the famous “200 OK” status code. If the site replies, the light is green. If it does not, the light is red. Easy.
It is also dangerously shallow. A “200 OK” only proves that something answered the front door. It tells you nothing about what is happening in the back rooms of the house. Database queries might be getting slower every hour. Memory might be quietly filling up. A disk might be on track to run completely full. None of that turns the light red, until it is too late, and then everything turns red at once.
Think of it like a doctor who checks only one thing: is there a heartbeat? Yes? Great, patient is fine, next. Meanwhile the patient’s blood pressure is climbing, their temperature is rising, and they are about to have a very bad afternoon. A pulse is necessary. It is nowhere near sufficient.
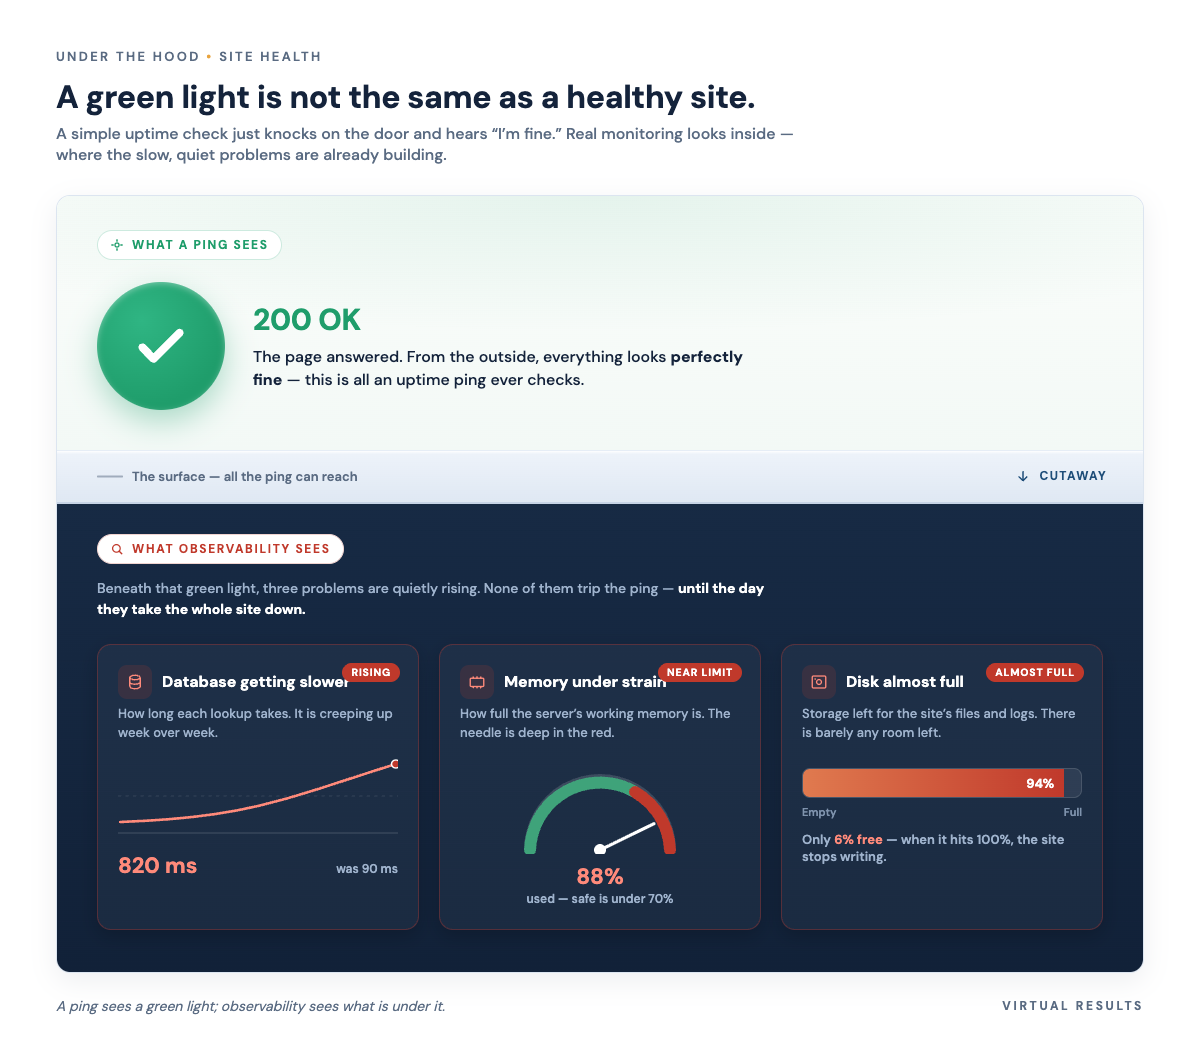
The grown-up version of this is called observability, a slightly nerdy word for a simple idea: instead of asking “is it up?”, you ask “how is it doing, and where is it heading?” That shift, from a yes/no light to a richly instrumented picture of the system’s internal state, is the whole game. We wrote about the broader philosophy of separating useful signals from background noise in Signal and Noise, our series on bots, scrapers, and traffic. This post is the flip side of that coin: not who is knocking, but how the house itself is holding up.
Why we measure things instead of reading logs
There is a tempting shortcut to “monitoring”: just watch the error logs and sound an alarm when errors pile up. Count the angry lines. When the count gets high, panic.
It works, sort of, the way a smoke detector that only triggers once the couch is fully on fire works. By the time errors are stacking up in the log, your site is already degrading. Visitors are already seeing slow pages. Log-counting is a lagging indicator: it reports the past, and the past is when you were still okay.
The better approach is to track real metrics: the live, numeric vital signs of each piece of the system. Not “how many errors happened” but “how busy are the workers,” “how long are database queries taking compared to a normal day,” “how much of the memory is used up.” Those numbers start drifting before anything breaks. They let us raise a hand and say “this is trending toward trouble” while there is still calm and time to act, instead of after the couch is ablaze.
Metrics tend to lead. Logs tend to lag. You want both, but you want to be alerted on the leading ones.
Alert on trends, not on tantrums
Here is the failure mode that quietly ruins most monitoring setups: alerting on every single event. Do that, and within a week the alerts become wallpaper. Everybody mutes them. The one real emergency arrives wearing the same costume as a thousand false alarms, and nobody looks up.
Complex software is chatty. It emits warnings the way a busy kitchen clatters: constantly, and mostly meaninglessly. A single warning during a traffic burst is often completely normal. The search engine pausing for a beat to tidy its memory under a sudden load? Fine. Expected. Go back to sleep.
The thing worth waking a human for is a trend. One stray warning is noise. A cluster of them in a short window is a pattern, and now something is genuinely under pressure and the situation is building, not blipping. Smart alerting draws that line on purpose: it ignores the one-off and escalates the cluster.
This is harder to build than it sounds, because it means encoding judgment (“how much, how fast, for how long”) into the system itself, rather than just forwarding every hiccup to a pager. But it is the difference between monitoring people trust and monitoring people learn to ignore.
One dashboard, many independent storytellers
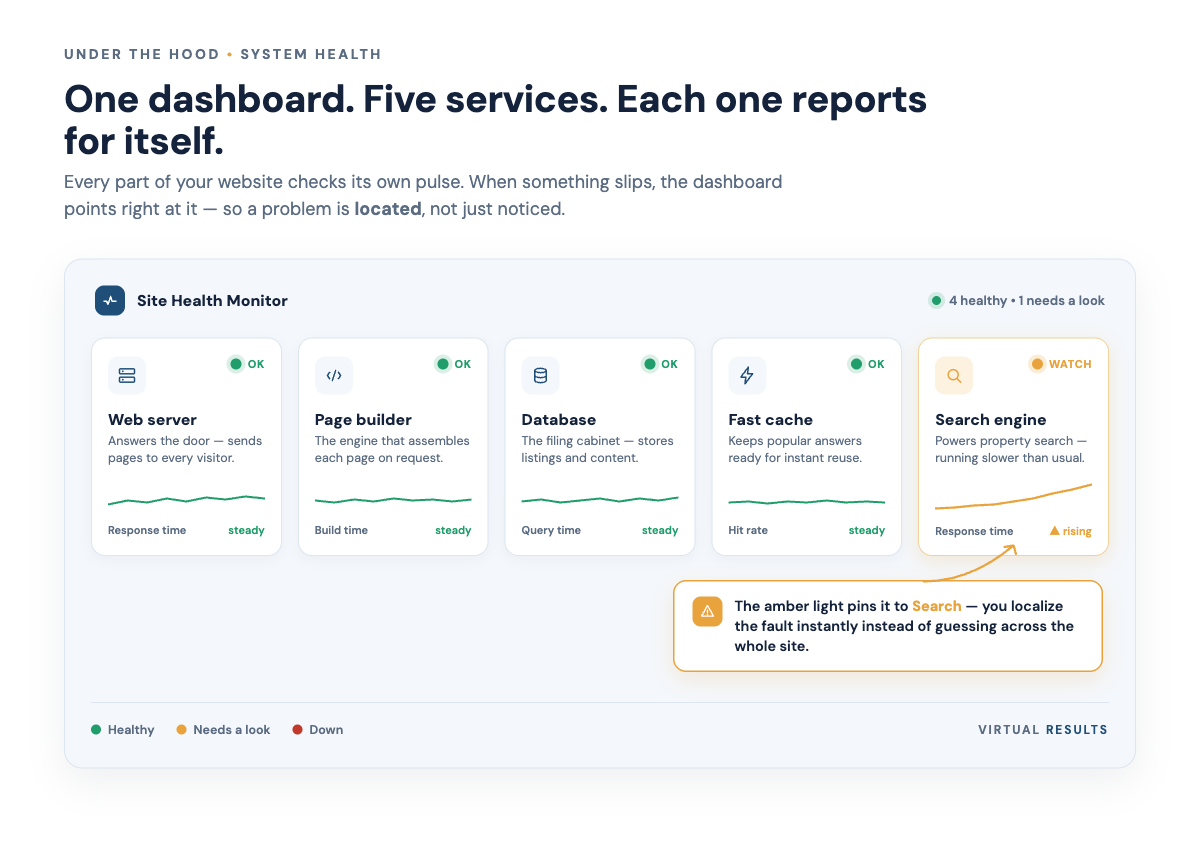
A modern real estate website is not one program. It is a small team of specialized services, each doing a different job, all cooperating to render the page you see:
- the web server, which greets every visitor and hands out pages;
- the PHP engine, which actually builds each page on the fly (WordPress sites lean on this heavily);
- the database, where your content and settings live;
- an in-memory cache, which remembers recent answers so they do not have to be recomputed every time;
- a search engine, which powers fast listing lookups and filtering.
If you monitor only the front door, a failure in any one of these shows up as a vague “the site is slow,” and then someone burns an hour guessing which room the smoke is coming from. The better design has every service report its own health, independently, to one shared dashboard. The web server says “I’m fine.” The database says “I’m fine.” Search says “I’m struggling.” Now you do not guess. You walk straight to the one room that needs attention.
This “localize it fast” instinct shows up across everything we maintain. It is the same reason we care about getting the small, specific things right, like what happens when a sold listing’s page goes away instead of returning an ugly dead end.
Four real gotchas, explained without the jargon
Generalities are easy. Here are four specific, genuinely sharp edges that real systems hit, the kind of thing good monitoring is built to catch. These are the texture of the unglamorous work.
1. The search engine’s “memory cliff”
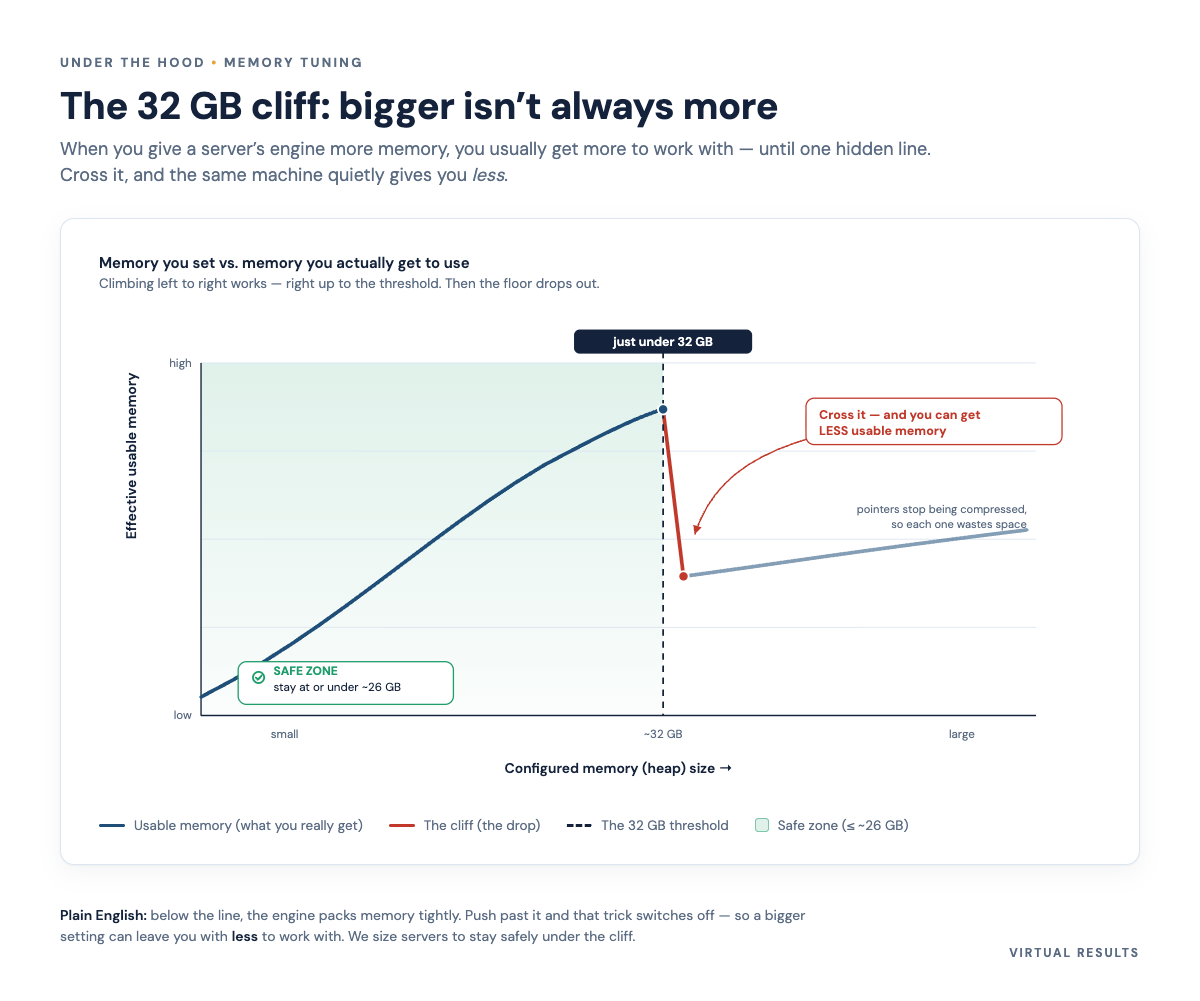
A search engine like Elasticsearch runs on the Java platform, which uses a chunk of memory called the heap. Intuition says: more memory is always better, so give it a giant heap. Intuition is wrong here, and the way it is wrong is genuinely surprising.
Below a certain size, Java uses a clever trick called compressed ordinary object pointers (affectionately, “compressed oops”) that lets it track memory with small, efficient pointers. Cross that threshold and the trick switches off. The pointers balloon to full size, and the practical amount of usable memory can actually drop, while the system spends more time cleaning up memory. You paid for more and got less. The threshold sits a little below 32GB, which is why Elastic’s own documentation recommends keeping the heap at or under roughly 26GB to stay safely on the efficient side of the line.
The fix is almost funny in its simplicity: keep the heap comfortably under the threshold. It is a perfect example of why running this stuff well is a craft, not a slider you drag to the right.
2. Ghost listings (“tombstones”)
When a listing is updated or removed, the search index does not always erase the old version on the spot. For efficiency, it marks the old copy as deleted and moves on, leaving behind what is literally called a tombstone: a soft-deleted record that still takes up room. Over time, on a busy site where listings come and go all day, these ghosts accumulate and quietly bloat the index, which makes search slower.
The cleanup is a periodic maintenance pass that sweeps out the tombstones and reclaims the space. It is the digital equivalent of a building’s nightly cleaning crew: invisible if it happens, very visible if it stops.
3. The waiter problem (the page-building workers)
The PHP engine builds your pages, and it does so with a fixed pool of workers. Each worker handles one request at a time, start to finish, like a waiter who can only serve one table before moving to the next. The size of that pool is capped on purpose (the relevant setting is called pm.max_children) because each waiter consumes memory, and an unlimited number of them would crash the whole restaurant.
Now a traffic spike hits: a listing goes viral, an email blast lands, a swarm of bots shows up. Suddenly there are more guests than waiters. New requests get stuck waiting in line. Pages stall. The site is not down (the front door still answers), it is just seized up, which to a visitor feels the same. Monitoring that watches worker saturation, how close the pool is to fully booked, sees this coming and raises a flag before the line forms. Not every spike is a real customer, by the way, which is why we care so much about telling humans from bots and keeping the automated traffic off the machinery that serves real visitors.
4. The log that ate the disk
Every service keeps a diary: logs of what it did and what went wrong. On a high-traffic site, those diaries can grow quickly. They are useful for diagnosis, but with a nasty failure mode: if a log file is left to grow unchecked, it can fill the entire disk. And when the disk is full, the whole site can go down, not from an attack, not from a bug, but from its own paperwork.
The unglamorous safeguard is log rotation: automatically capping each log, archiving and trimming the old entries, so the diaries stay a manageable size. Nobody puts “we rotate the logs” on a sales page. It is, nonetheless, one of the quiet things that keeps a site alive.
The point: predictive, not reactive
Pull all four gotchas together and a theme emerges. In every case, there is a measurable signal that drifts before the failure: memory creeping toward the cliff, tombstones piling up, workers filling the pool, a disk shrinking. Reactive monitoring waits for the crash and then tells you about it. Predictive monitoring watches those signals approach a pre-set line and speaks up while the problem is still small, still fixable, and still invisible to your visitors.
That is the whole philosophy in one sentence: catch it as the metric crosses the threshold, not as the site crosses into the dark. The win condition is not a heroic recovery at 3 a.m. The win condition is that 3 a.m. is boring.
We will be honest about the tradeoff, because there always is one: building monitoring this way is more work than dropping in a one-line uptime checker, and it demands ongoing tuning. Thresholds drift, traffic patterns change, and what was a sane alert last quarter becomes noise this quarter. It is a garden, not a statue. But for something your business genuinely runs on, we think the unglamorous, attentive version is worth it. It also pairs naturally with keeping the bad actors out and putting a smart filter at the gate.
If you would rather not think about heap cliffs and worker pools at all, and would rather just have this handled while you go sell houses, that is what we do. Say hello.